How to diagnose where engineering delivery is actually broken
Victor Demin has 15+ years helping engineering organizations improve delivery speed, predictability, and system health.
· 18 min read
Most slow engineering teams don't have a productivity problem. They have a flow problem. And almost everyone's first reaction to it makes the system slower.
Here's a pattern I've seen many times over the years: a team of six with 60–80 active tasks on the board, releases that have stretched from days to weeks to "we'll get to it next month," and a very reasonable conclusion that more hands will fix it. Usually that's not the real bottleneck.
The diagnostic decomposes the timeline of a single task — from idea to user — until you can point at the specific stage where the system stops working. Once you can point at it, the fix is usually obvious; most of the time it doesn't involve hiring anyone. The order below mirrors a real engagement: symptoms → decompose → find the bottleneck → talk about the lever.
1. Symptoms of slow delivery — and the wrong first reflex
The first conversation almost always starts the same way. T2M is in months. Throughput is near zero. There are more bugs on the board than open tasks. The team's NPS — internal or external — is sitting somewhere between bad and worse.
The engineers are working, the EM is trying, the PM is grinding through a backlog. And yet the first reflex, every single time, is "we need more engineers" — the wrong reflex.
Here's why. When a program doesn't work, we don't fix it by adding more developers to the source tree. We open a debugger. We look at what state the program is in, where it's getting stuck, what it's actually doing versus what we expected. The same is true for an engineering system. The metrics above tell you the outcome is bad. They don't tell you where the system is breaking down. Scaling the team without that information just makes the system more complex — more handoffs, more in-flight work, more queue depth — and almost always slower.
So before any conversation about hiring, the work is to break the process down into its parts and find where it starts to degrade. That's the moment the metrics stop being a report card and start being a diagnostic tool.
2. Decompose T2M — Discovery and Lead Time aren't the same problem
When a task first appears, it isn't really a task yet. It's a raw idea — a customer request, a bug report, a hypothesis from the founder, a thing someone noticed in a meeting. Before the team can build it, someone has to shape it: clarify what it actually means, sketch the solution, decide whether it's worth doing, get the right approvals. Not every idea makes it through that stage, and the ones that do don't always make it quickly.
That gap is important, because it's where a lot of teams burn weeks without realizing it. T2M — Time to Market — is the total time from idea to production. The first useful cut on it is the boundary between Discovery and Delivery.
Discovery is everything that happens before a ticket is genuinely ready to be picked up by a developer. Requirements clarification, design, scoping, stakeholder alignment, prioritization. Output: a ticket someone could actually start building.
Delivery is everything after that point — from "ready for development" to "in production." This is what most engineering metrics implicitly measure, and it's the slice the team has direct control over.
The metric I use for the second half is Lead Time: the time a ticket spends specifically inside the development team's responsibility. So:
T2M = Discovery + Lead Time (Delivery)
Two numbers, two very different problems hiding behind a single broken T2M.
If T2M is high but Lead Time is low, the bottleneck is upstream of engineering. The team can execute, but work is sitting in analysis, waiting on a stakeholder, queued behind a prioritization decision that hasn't been made. Hiring more engineers won't help — they'll just be idle in a different way. The work is to fix the Discovery pipeline: who decides what's ready, on what cadence, with what input.
If Lead Time is high, the problem is inside Delivery itself. Tasks are getting stuck after the team picks them up: in coding, in review, in QA, in deploy. We need to look inside Lead Time and figure out where, specifically, the time is being spent.
In practice, most teams I work with have problems on both sides — but rarely in equal proportion. The first thing the T2M vs Lead Time split does is tell you which conversation to have first. The Discovery side is usually a conversation with the founder, the PM, and whoever owns prioritization. The Delivery side is a conversation with the EM and the team. Conflating the two is one of the more reliable ways to make the wrong fix.
Inside Lead Time, "working on a task" and "the task being worked on" turn out to be different things — and that's where things get interesting.
3. Lead Time = Waiting + Cycle Time
Most teams think that once a task is "ready for development," real work has started. It hasn't. The task gets put on a board. A developer is busy with the previous one. Someone's on vacation. A higher-priority bug jumps the queue. The ticket sits there. From the board's perspective, the task is "in progress." From the system's perspective, it's just waiting.
This is why Lead Time on its own isn't sharp enough. We need to separate the time a task is actually being worked on from the time it's just sitting in a queue. The metric I use for that is Cycle Time — the time from when a task is genuinely picked up to when it's done. Real work only.
Stacked up:
T2M = Discovery + Lead Time Lead Time = Waiting + Cycle Time Cycle Time = work, only
Same timeline, three different measurements. Each metric points at a different bottleneck.
Two more diagnostic questions fall out of this.
If Cycle Time is high, the problem is inside development itself. Once people are working on a task, the task is slow to finish. The bottleneck is in execution: code complexity, review delays, flaky test suites, manual QA cycles, painful deploys. That's where you start looking with the team.
If Cycle Time is low but Lead Time is high, the team is fine. Execution is fine. The system has more incoming work than it can handle. Tasks are piling up in the queue, waiting for the team to finish the previous batch before they can even be started.
This second case is the one that catches founders off guard. The team is moving fast on each individual task. The board still looks frozen. The instinct is to push harder on individual throughput — when the actual problem is upstream demand versus team capacity. The right conversation here isn't about speeding up the team. It's about either adding capacity in a targeted way or limiting how much work the team accepts at once. We'll get to that.
Quick diagnostic table for the first conversation with leadership:
What the metric shows
What it means
High Cycle Time
Execution problem — look inside dev.
High Lead Time, normal Cycle Time
Demand exceeds capacity.
Low Cycle Time, low Lead Time, high T2M
The bottleneck is in Discovery, not Delivery.
That's three numbers. You can pull all of them from Jira or Linear in an afternoon, and they'll already tell you a different story than "we need to hire."
4. Where work actually gets stuck: why time-in-status can mislead
So Cycle Time is high. The natural next move is to look inside it: measure time-in-status. In Progress, Code Review, QA, Deploy. Add up where the hours go. Find the slowest column. Fix it.
This is the move most teams make, and it works — to a point. If your tasks are getting stuck in code review, you can read off the column-time and start a real conversation about reviewer load, PR size, review SLA. Same with QA bottlenecks, same with deploy queues. The data is real and the intervention is targeted.
But there's a trap, and I want to be specific about it.
Tasks don't move through stages linearly. They bounce back: from QA to development when a bug is found, from review back to work when a comment lands, from deploy back to dev when something fails in staging. The same task crosses the same stage two, three, sometimes five times. The moment you start measuring "average time in QA," that average is silently mixing first-pass tickets with their third QA bounce.
What most teams do at this point is double down on measurement. More granular dashboards. Track every transition. Add metrics for "first-pass QA failure rate" and "review bounces per ticket." Wire up custom Jira reports. Eventually you have a beautiful instrument that nobody can act on, because the data has gotten complicated faster than the underlying system has gotten clearer.
The mistake is that you're trying to measure the system at the wrong level. Local optimization — making each column faster — assumes work flows linearly. It doesn't. The system isn't a pipeline; it's a flow with eddies, loops, and queues.
The shift that actually helps is to stop trying to measure each stage more precisely and start asking how work is moving through the system as a whole. Not "where do tickets sit longest," but "how many tickets are in the system at once, and what's the proportion that's actually advancing versus just being held there." Once you ask that question, the rest of the diagnostic gets a lot simpler.
5. How to find bottlenecks without measuring time
Here's the most underrated diagnostic move I know.
You don't need to measure time in each status to find the bottleneck. You just need to count the tasks in each status.
Pull the counts from Jira in five minutes. The shape almost always looks something like this:
Where tasks accumulate, the system's capacity is hitting a ceiling.
Then look for imbalances.
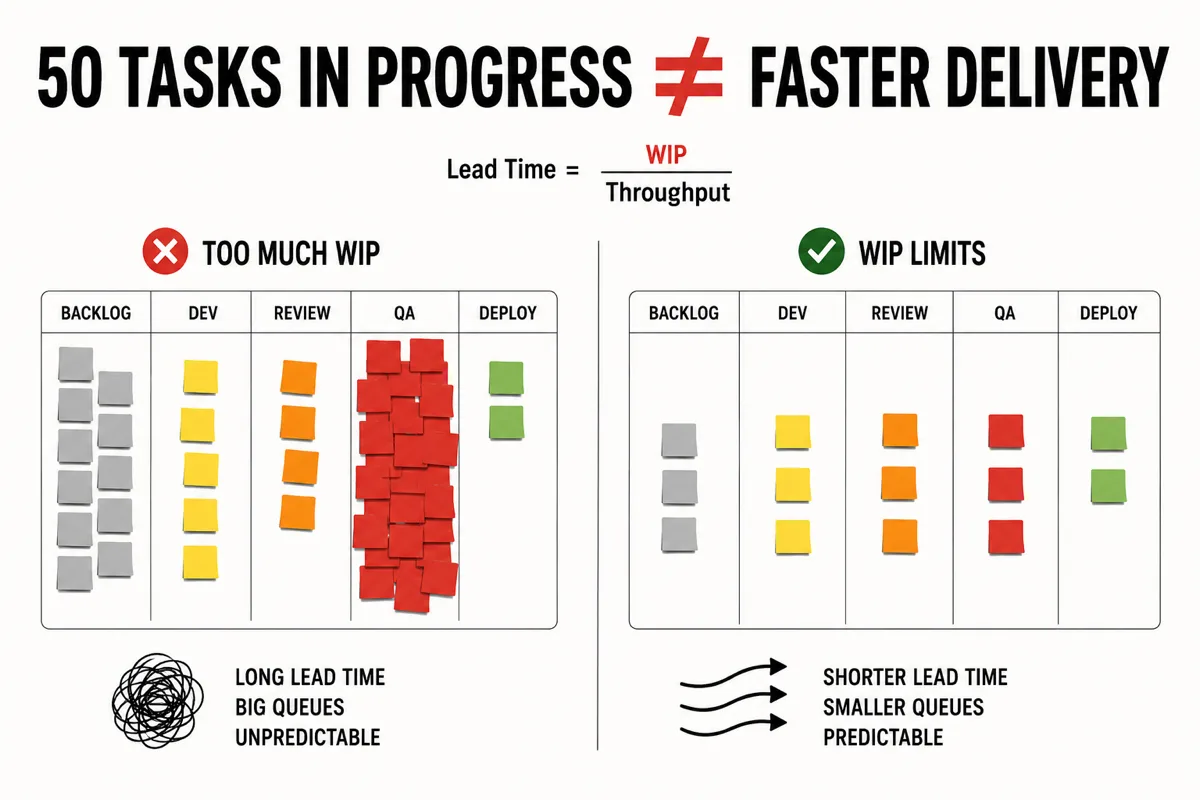
If you have five tasks in development, three in review, and twenty-five in QA — you don't need a stopwatch. You don't need a Looker dashboard. The bottleneck is QA. Not because tasks are individually slow there, but because tasks are queuing up there. The system has a place where work accumulates faster than it dissipates.
This single counting exercise tells you almost everything time-in-status would, with about one percent of the effort. It works because queues are the visible side of a flow problem — wherever queues form, that's where the system's capacity is hitting its ceiling.
It also reframes the conversation. Time-in-status invites a debate about "how long is too long in QA." Task-count makes the problem self-evident: twenty-five things waiting on two QA engineers is a system-shaped problem, not a "QA people need to work faster" problem.
This is the cheapest, fastest diagnostic in the playbook, and most teams skip straight past it on the way to building dashboards they'll never use.
But it raises a deeper question. Why are twenty-five tasks in QA? Where did they come from? Why does the team keep accepting new work when there's already a wall of unfinished tickets in the system?
6. Work in Progress (WIP): the variable that controls delivery speed
Six engineers. Eighty tasks in progress. Nothing gets done.
It's not an exaggeration. I've seen this exact shape multiple times. A team of three developers, two QA engineers, and a tech lead — eighty-plus active tickets on the board. For a team of six.
The story behind it is always the same. A developer finishes the active part of a task and pushes it to review. Their current ticket is now blocked on someone else. Rather than wait, they grab another from the backlog. That one gets blocked too — waiting on QA. They grab another. The board fills up with tasks that are technically "in progress" but actually waiting on someone else, somewhere else, for some other reason.
This is Work in Progress (WIP) — the number of tasks the system is holding at any one time.
The team can't physically work on eighty things at once. Six people, eighty tasks. Most of the work is just sitting. Waiting on review, blocked on QA, parked because a stakeholder hasn't responded, partially done and merged but not yet deployed. Each of those tickets is using a slot in the system — a slot in someone's mental context, a place on the board, a piece of state someone is responsible for keeping warm.
The cost compounds:
Tasks lose business relevance while they wait. By the time the team gets back to them, the requirements have shifted or the urgency has evaporated.
Merge conflicts accumulate. A feature branch that sits for three weeks while the main branch keeps moving becomes a small archaeological project to integrate.
Context switching gets expensive. Every developer is mentally holding three or four "in progress" tasks at once. None of them are actually advancing.
Bugs get easier to ship. With more in-flight work, fewer eyes are on each piece. Quality drops.
And the metrics confirm it. High WIP correlates with high T2M (tasks take longer to get out), low Throughput (fewer tasks finish per week), more bugs (less attention per task), and lower NPS — both customer and team.
This is the variable that controls the system. Not how fast the team is. Not how senior the engineers are. How much they're trying to hold in flight at once.
7. Little's Law: Lead Time = WIP / Throughput
If the previous sections feel like they keep arriving at the same conclusion, you're not wrong. There's a reason.
Operations research figured this out decades ago. The relationship between the amount of work in a system and how long that work takes is captured by Little's Law:
Lead Time = WIP / Throughput
In the language of software delivery:
WIP — how many tasks are in the system at the same time
Throughput — how many tasks the team completes per period
Lead Time — how long a task lives in the system, on average
The formula is almost embarrassingly simple, and the implication is brutal.
Hold throughput constant and increase WIP, and lead time scales linearly. Worked example: a team that completes ten tasks per week.
10 tasks in the system → avg lead time ≈ 1 week
30 tasks → ≈ 3 weeks
80 tasks → ≈ 8 weeks
The team is working at the same speed in all three scenarios. The individual engineers aren't slower. The tickets aren't more complex. The only thing that changed is how many tasks the system is trying to hold simultaneously. And the average lead time stretched by 8x.
This is why teams that work harder don't necessarily ship faster. You can crank throughput up by 10–20% with effort. You can crank WIP down by 50% or more with discipline. The math says the second lever moves results more.
It's also why "we need more engineers" so often makes things worse. New engineers bring their own in-flight work. WIP goes up faster than throughput, and lead time gets worse before it gets better. Onboarding makes this almost guaranteed — the new hires take six to eight weeks to start contributing meaningfully, and during that period the existing team's WIP increases (mentoring, context handoff, reviewing the new hire's PRs).
If you take one number, take this one. Lead Time = WIP / Throughput.
It's the system math behind almost every "we're moving slow" engineering conversation I've ever had.
8. WIP limits: the lever that fixes most slow engineering teams
So if WIP is the variable that controls system speed, and we usually can't change throughput dramatically in the short term, the lever is obvious: limit WIP.
Most engineering teams have a productivity problem because they have a WIP problem. Fix the WIP, and most of the other symptoms — long lead times, frequent bugs, low predictability, perpetual context switching — improve at the same time.
WIP limits are the discipline of saying: this system will hold no more than N tasks at once. If WIP is at the limit, no new work gets started until something existing finishes. Period.
Same throughput, different WIP: queues shrink and lead time becomes predictable.
What WIP limits actually improve:
Less context switching, because each person is holding fewer in-flight things
Shorter queues at each stage, because there's less in the system overall
Shorter Lead Time, by Little's Law, mechanically
Fewer bugs, because attention is concentrated on finishing rather than starting
Higher predictability, because the system stops oscillating between underloaded and gridlocked
What WIP limits don't do — and this is the part that confuses leadership — is make individual developers move faster. They make the system move faster. The team isn't producing more code per person-hour. It's just producing fewer parallel half-finished pieces of code, which means more of what they produce actually ships.
This is also one of the very few levers that improves delivery without hiring, without new tools, and without process redesign. It costs nothing. It can be applied this week. And almost nobody does it, because it requires saying "no" to starting new work — and saying "no" to a stakeholder asking for one more thing in flight is harder than saying "yes."
WIP limits aren't really about Jira settings. They're about whether the team and its stakeholders have the discipline to finish before they start.
9. How to introduce WIP limits without team revolt
The math is one thing. Convincing the system to adopt it is something else. The number of teams who have read about WIP limits, tried to implement them, and quietly abandoned the attempt is large. I'd guess most of them.
Here's the failure mode. Someone — usually the EM or a senior engineer who read the Kanban book — declares: "starting Monday, WIP limit is 5 per developer, no exceptions." Two weeks later it's gone. The reasons it died are predictable:
Developers see colleagues blocked on review or QA, refuse to "sit idle" while there's work in the backlog, and quietly start new tickets anyway
A stakeholder needs an urgent thing, the EM gets pressure from above, the limit is suspended "just this once"
Leadership walks past the engineering area, sees people not visibly typing, and asks why the team isn't fully utilized
The mistake is introducing WIP limits as a rule rather than as a focus shift. Almost nobody — neither developers nor leadership — finds the rule itself intuitive. From the outside, telling a developer not to pick up new work looks irrational. It's a posture against scarcity, in a culture that rewards starting things.
So I rarely start with the limit itself. I start by shifting the team's focus from starting work to finishing work. The limit gets internalized after the focus shift, not before.
The sequence I use, roughly:
Make the goal explicit. The objective is not to start more work. It's to finish work that's already been started. Repeat this regularly. Print it on a sticker. Whatever it takes for the framing to land.
Explain why. Show the team Little's Law. Show them the count-tasks-per-status diagnostic. Make the case from system math, not from authority. People follow practices they understand far better than rules they don't.
Show real examples. Reference cases where introducing WIP limits visibly changed the system — your own past teams, posts like this one, war stories from others. Pattern-matching does most of the work that exhortation can't.
Bring the focus back, often. Whenever someone is about to pull a new task, ask: "what can you do right now to move existing work to completion?" Help unblock a teammate. Run a review. Answer a QA question. Pair on resolving a long-standing merge conflict. The team's instinct is to grab fresh work; the discipline is redirecting that instinct.
There's a story from a comment under one of my own posts that captured this well. A team set WIP = 5. The stakeholders initially saw it as a failure — too few things visibly happening at once. Within a quarter, delivery speed had improved, quality had improved, collaboration had improved, predictability had improved. The stakeholder view flipped. They stopped asking "why are so few things active" and started asking "why aren't we using WIP limits in other parts of the company."
The hardest part is usually not the engineering team. It's the management layer that equates utilization with productivity. If everyone on a team is "100% busy," management feels comfortable; if anyone is visibly between tickets, alarm bells go off. The truth, which is uncomfortable, is that a team running at 100% utilization is almost always shipping less than a team running at 80%. Slack in the system is what lets work flow through it.
WIP limits don't have to be Kanban-formal. You don't need to print numbers on the board. You just need the team and its stakeholders to agree, in practice: we finish before we start.
10. The full system view: speed, value, and sustainability in engineering delivery
Speed alone is not a complete picture. Any engineering metrics framework that only optimizes for speed will eventually break something more important.
The full diagnostic model has three dimensions:
System speed — how fast we ship changes.
T2M (Time to Market) — total time from idea to production
Throughput — tasks completed per period
Lead Time, Cycle Time, WIP — the decomposition we've already walked through
Product value — whether what we ship is actually useful.
Quality — open bugs, regression rate, incident rate
NPS / customer satisfaction — does the user feel like the product is getting better
Team sustainability — whether the team can keep operating this way.
eNPS (Employee NPS) — would the team recommend working here
Burnout signals, attrition rate, on-call load
The reason all three matter, together, is that any two can be temporarily faked at the expense of the third. You can ship faster by skipping QA and burning the team — speed goes up, value and sustainability collapse. You can polish quality to perfection and ship nothing — value per feature goes up, but the team and the company stagnate. You can keep the team happy and idle — sustainability is great, speed is zero.
A working delivery system holds all three dimensions in tension. It's fast enough that the business can compete, valuable enough that customers stay, and sustainable enough that the team will still be here next year. When founders ask me what "good" looks like, this is the answer: not a single number, but three numbers moving roughly together.
The eNPS metric in particular gets overlooked because it feels softer than the rest. It isn't. It's the early warning system for everything else. A team whose eNPS is dropping will, in three to six months, start losing senior people. The replacements will be juniors who need ramp-up. WIP will rise, knowledge will get thin, quality will drop, bugs will multiply. The metric you saw moving first was the one you ignored.
You can compute almost all of these from Jira plus an HR pulse survey. None of them require a special tool. What they require is the willingness to look at the system honestly, all three dimensions at once.
When metrics become a diagnostic tool
The metrics aren't new. Neither are the ideas — Theory of Constraints (1980s), Toyota Production System (1950s), the Kanban Method for software (David Anderson, 2000s), and Little's Law (1961) all describe different aspects of the same underlying problem: work moves through systems, and systems slow down when flow breaks. What's new is whether your team uses them as a report or as a diagnostic. A report tells you something is broken. A diagnostic tells you where.
When delivery is slow, the temptation is to react to the report — hire engineers, add process, install a new tool. The reaction looks like motion. It usually isn't progress. Progress starts when the metrics become specific enough to point at the actual constraint.
If you're staring at a board with 60–80 active tasks and a team of six, count the tasks per status. Measure Lead Time and Cycle Time. Look at the relationship between WIP and throughput. The system math will do most of the work.
FAQ
What's the difference between Lead Time and Cycle Time?
Lead Time
Total time a task spends inside development — from “ready for development” to “in production.” Includes the waiting.
Cycle Time
Just the active work portion — from “actually picked up” to “done.” Excludes the waiting.
The gap between them is queue depth.
What's a reasonable WIP limit for a team of N?
Industry guidance ranges from 1–3 tasks per developer; software-dev teams typically run on the tighter end — 1–2 per dev.
Team of 6 → ~6–12 active tasks system-wide, not 80.
The exact number matters less than the discipline of having one and enforcing it — most teams find their right level by starting tight and relaxing if work consistently stalls for non-WIP reasons.
How is this different from Scrum sprint capacity?
Sprint capacity
How much work the team commits to for a two-week period.
WIP limit
How much work is in flight at any given moment, regardless of sprint.
A team can have a sensible sprint commitment and still be running 60+ tasks in parallel — sprint capacity says nothing about whether work is being finished versus just started. WIP limits are orthogonal to sprint planning and tend to fix problems sprint planning alone doesn't reach.
What if our throughput is genuinely too low?
Sometimes throughput really is the constraint. If WIP is already under control and Lead Time remains high, the team may not have enough capacity for the demand.
Before hiring, check three things:
Are tasks oversized?
Is execution itself slow?
Is the team spending serious time on non-delivery work? Support, incidents, meetings, operational load.
If those are all clean and throughput still lags demand, hiring may be the right call. WIP limits don't replace hiring — they help distinguish a capacity problem from a flow problem.